Input data (legacy)
Intro
(Note! This page details the previous format of the input data, that can be used with the SOM model by pre-processing it. To do so, make sure to set the use_legacy_input_data option to true in the configuration file)
The input data consists of three files:
- exampleData.xlsx
- exampleEffect.xlsx
- examplePressureState.xlsx
Example data has been provided in the data directory.
Please note that most column names are case sensitive.
General Input
exampleData.xlsx contains descriptions of the model domain:
ID sheets

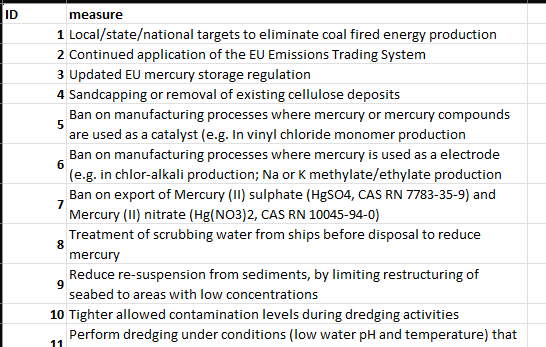
sheet:Measure ID
| Column | Type | Description |
|---|---|---|
| ID | Text | Unique measure identifier |
| measure | Text | Measure description / name |
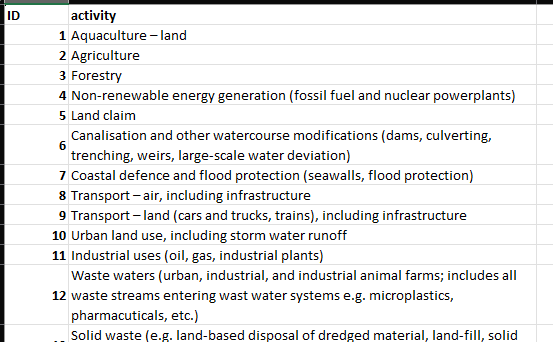
sheet:Activity ID
| Column | Type | Description |
|---|---|---|
| ID | Text | Unique activity identifier |
| activity | Text | Activity description / name |
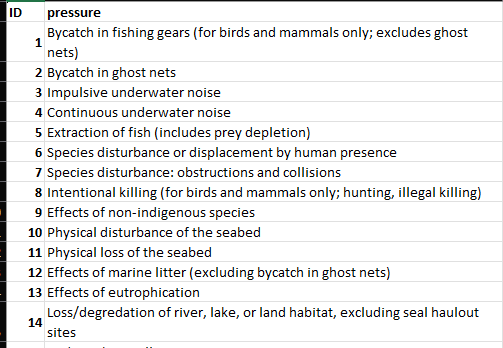
sheet:Pressure ID
| Column | Type | Description |
|---|---|---|
| ID | Text | Unique pressure identifier |
| pressure | Text | Pressure description / name |
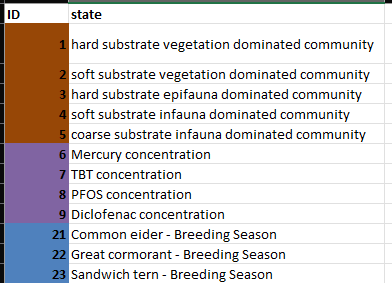
sheet:State ID
| Column | Type | Description |
|---|---|---|
| ID | Text | Unique state identifier |
| state | Text | State description / name |
sheet:Area ID
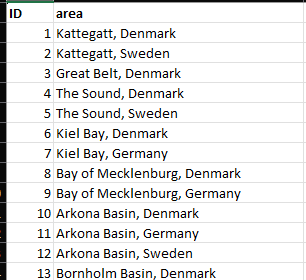
| Column | Type | Description |
|---|---|---|
| ID | Text | Unique area identifier |
| area | Text | Area description / name |
sheet:Case ID
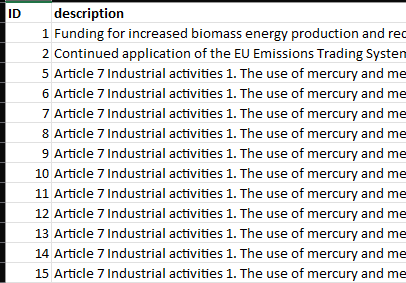
| Column | Type | Description |
|---|---|---|
| ID | Text | Unique case identifier |
| case | Text | Case description / name |
sheet:ActMeas
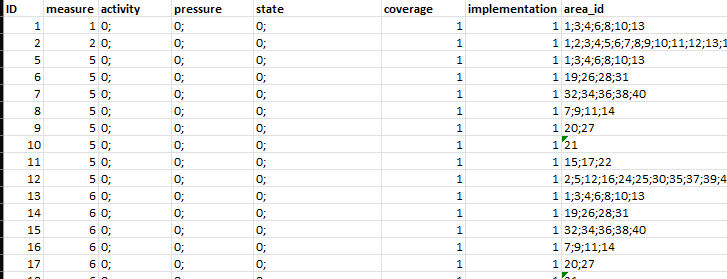
- Implemented measure cases, all rows are independent, multiple IDs can be joined by a semi-colon
| Column | Type | Description |
|---|---|---|
| ID | Text | Case ID, linked to sheet:Case ID |
| measure | Text | Measure ID, linked to sheet:Measure ID |
| activity | Text | Relevant Activity IDs, linked to sheet:Activity ID, the value 0 (zero) means all relevant activities affected by the measure |
| pressure | Text | Relevant Pressure IDs, linked to sheet:Pressure ID, the value 0 (zero) means all relevant pressures affected by the measure |
| state | Text | Relevant State IDs, linked to sheet:State ID, the value 0 (zero) means all relevant states affected by the measure |
| coverage | Number | Multiplier (fraction), represents how much of the area is covered by the measure |
| implementation | Number | Multiplier (fraction), represents how much of the measure is implemented |
| area_id | Text | Area ID, linked to sheet:Area ID |
sheet:ActPres

- Activity-Pressure links, how much the individual activities contribute to the pressures
| Column | Type | Description |
|---|---|---|
| Activity | Text | Activity ID, linked to sheet:Activity ID |
| Pressure | Text | Pressure ID, linked to sheet:Pressure ID |
| area_id | Text | Area ID, linked to sheet:Area ID, multiple IDs can be joined by a semi-colon |
| Ml# | Number | Most likely contribution (%) |
| Min# | Number | Lowest potential contribution (%) |
| Max# | Number | Highest potential contribution (%) |
sheet:DEV_scenarios
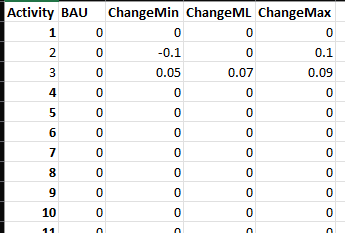
- Activity development scenarios
| Column | Type | Description |
|---|---|---|
| Activity | Text | Activity ID, linked to sheet:Activity ID |
| ### | Number | Subsequent columns are treated as the change / scenarios (fraction) |
sheet:Overlaps
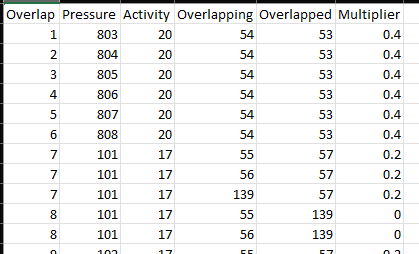
- Interaction between separate measures, how joint implementation affects measure efficiency
| Column | Type | Description |
|---|---|---|
| Overlap | Text | Overlap ID |
| Pressure | Text | Pressure ID, linked to sheet:Pressure ID |
| Activity | Text | Activity ID, linked to sheet:Activity ID |
| Overlapping | Text | Overlapping measure ID, linked to sheet:Measure ID |
| Overlapped | Text | Overlapped measure ID, linked to sheet:Measure ID |
| Multiplier | Number | Multiplier (fraction), how much of the column:Overlapped measure's effect will be observed if column:Overlapping is also implemented |
sheet:SubPres
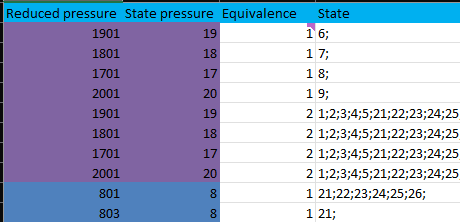
- Links between separate pressures, where subpressures make up part of state pressures
| Column | Type | Description |
|---|---|---|
| Reduced pressure | Text | Subpressure ID, linked to sheet:Pressure ID |
| State pressure | Text | State pressure ID, linked to sheet:Pressure ID |
| Equivalence | Number | Equivalence between column:Reduced pressure and column:State pressure, i.e. how much of the state pressure is made up of the subpressure, where values between 0 and 1 are treated as fractions, and other values as either no quantified equivalence or no reduction from pressures |
| State | Text | State ID, linked to sheet:State ID |
Measure efficiencies
exampleEffect.xslx contains survey data on the effects of measures on activity-pressure pairs as surved by expert panels:
sheet:MTEQ
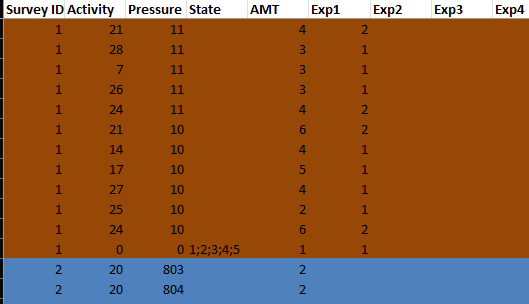
- General information on the survey questions, each row corresponds to a unique activity-pressure pair, the value 0 (zero) for the Activity, Pressure and State columns is used to denote no value, used for direct to pressure / direct to state measures
| Column | Type | Description |
|---|---|---|
| Survey ID | Text | Survey ID, each unique id corresponds to a specific sheet in exampleEffect.xslx |
| Activity | Text | Activity ID, linked to exampleData.xlsx:Activity ID |
| Pressure | Text | Pressure ID, linked to exampleData.xlsx:Pressure ID |
| State | Text | State ID, linked to exampleData.xlsx:State ID |
| AMT | Integer | Amount of measures linked to the activity-pressure pair in the corresponding survey sheet |
| Exp# | Integer | Expert columns, details the number of experts that gave each answer, used for weighting |
sheet:Surveys
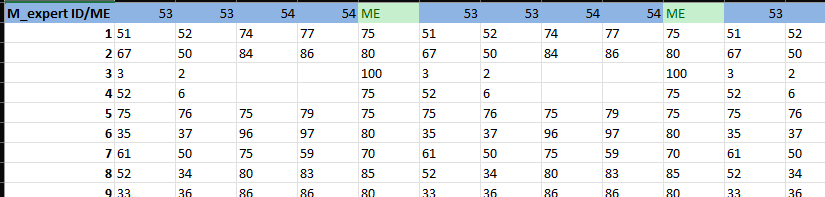
- Survey sheets detailing the effects of the measures on the activity-pressure pairs in
sheet:MTEQ
| Column | Type | Description |
|---|---|---|
| expert ID | Text | Expert ID, linked to the corresponding expert columns in sheet:MTEQ |
| # | Number | Measure IDs as columns, linked to exampleData.xlsx:Measure ID, each measure takes two columns, where the first column describes the most likely reduction (%) of the measure on the activity-pressure pair, and the second column describes the potential uncertainty range (%) regarding the reduction |
| ME | Number | The actual effect of the most effective measure for the current activity-pressure pair |
Pressure contributions and GES thresholds
examplePressureState.xlsx contains survey data on pressure contributions to states and total pressure load reduction targets:
sheet:PSQ

- General information on the survey questions, each row corresponds to a unique state-area pair
| Column | Type | Description |
|---|---|---|
| State | Text | State ID, linked to exampleData.xlsx:State ID |
| area_id | Text | Area ID, linked to exampleData.xlsx:Area ID, multiple IDs can be joined by a semi-colon |
| GES known | Integer | Is the GES threshold known, 0 for no, 1 for yes |
| Exp# | Integer | Expert columns, details the number of experts that gave each answer, used for weighting |
sheet:Surveys
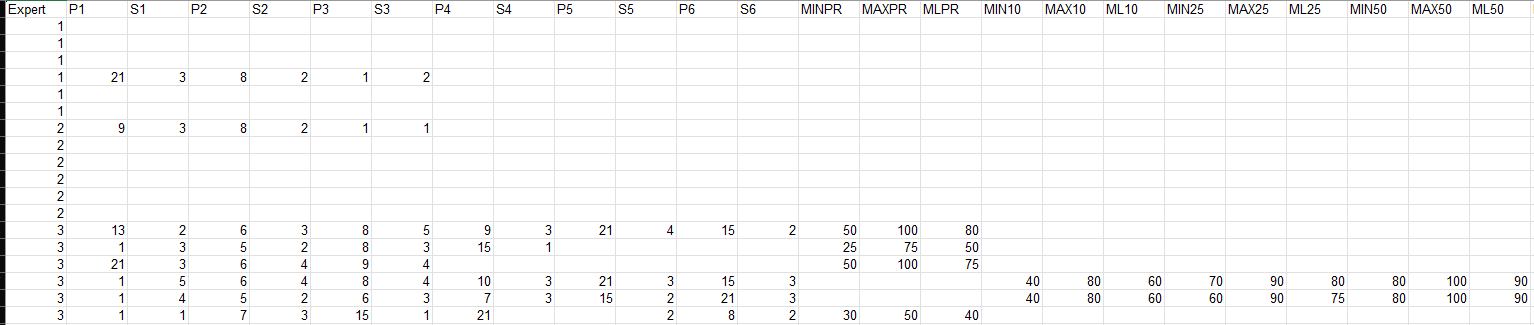
- Survey sheets detailing the contributions of individual pressures to states and the total pressure load reduction targets for the state, the example targets are for PR (=GES), 10 %, 25 % and 50 % improvement in state, but any amount of targets may be included as long as they follow the naming scheme seen above
| Column | Type | Description |
|---|---|---|
| Expert | Integer | Expert ID, linked to the corresponding expert columns in sheet:PSQ, each expert's answers comprise a block of rows corresponding to the state-area pair rows in sheet:PSQ |
| P# | Text | Pressure IDs, linked to exampleData.xlsx:Pressure ID |
| S# | Text | Significance of corresponding column:P#, used when weighing contributions of each pressure |
| MIN# | Number | Lowest potential threshold value (%) |
| MAX# | Number | Highest potential threshold value (%) |
| ML# | Number | Most likely threshold value (%) |